DOT Tracking Grading Report
On this page
Introduction
The DOT Tracking Grading reports provide a way to compare driver performance and to produce a report that may be given to a driver for their own analysis. There are 2 Grading reports; The Grading Detail and the Grading Summary.
- The Grading Detail report is designed to be given to a driver to make them aware of their performance and change over time
- The Grading Summary report is a multi-driver report, listing all drivers and a summary of their grading performance.
The scores are based off of the points set in the Analytics Configuration and are then applied to a fixed scale to apply a grade from A to F, continue below for more information.
Grading Detail Report
We will first look at an example of a Grading Detail report. A report can be generated 1 of 2 ways:
- Through Reports on the DOT Tracking main menu. Select 'Grading Detail' and select the required criteria - you may generate reports for more than one worker at a time using this method
- Through Analytics Grading. On the Grading page in Analytics hover over the
 icon and select 'Grading Report'.
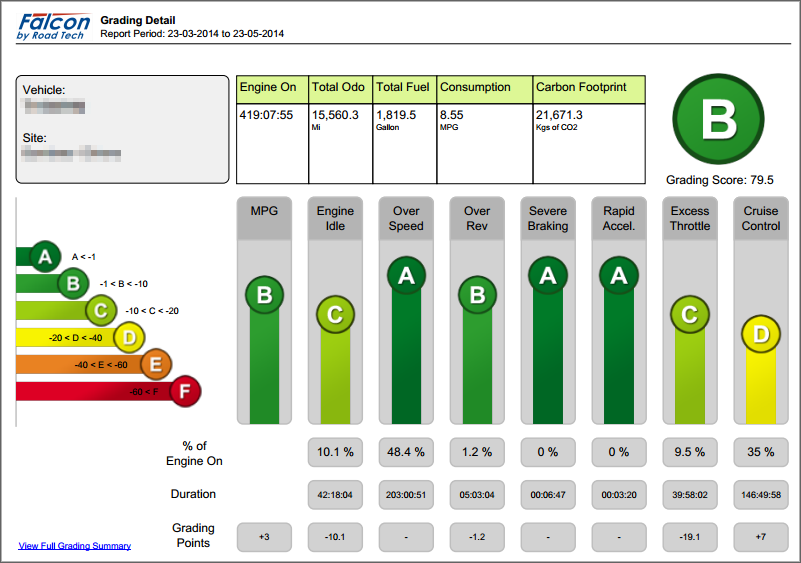
Look at an example report below:

The report consists of 2 main sections, the summary and the metrics, we will look at each one:
Summary

The summary table displays data related to the selected report period. The Engine On time is an important factor, all metric performances are based from this.
Beside the summary table is the overall grade and score for the report period:

The score is calculated the same way as the scores in Analytics Grading. From this score a grade letter is applied using the following rules:
- Score of 80 or higher is given an A
- 70 or higher B
- 50 or higher C
- 30 or higher D
- Less than 30 receives an E grade
Metrics
Each metric is displayed as a vertical bar with the resulting grade overlayed:

The bar height and letter represent the awarded grade. Below are details for that metric that relate to the grade:

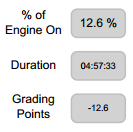
Here we can see the percentage of engine on time this metric is accounting for, the actual duration and the number of points subtracted or added to the final score.
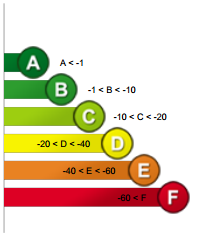
Beside the metrics is a key showing how each grade is granted:

For the grading points of each metric a grade letter is assigned. For all but MPG and Cruise Control, the following rules apply:
- Having less than 1 point taken away awards an A
- Between -1 point and -10 points awards a B
- Between -20 and -40 a C
- Between -40 and -60 a D
- And anything less than -60 awards an F grade.
For Cruise Control the following applies:
- A score of 20 or more awards an A
- 15 or higher B
- 8 or higher C
- 4 or higher D
- 2 or higher E
- Any score less than 2 will award an F grade.
The MPG grade is based off of the Vehicle Type rules in DOT Tracking Settings. For this to take an effect you must assign a Vehicle Type to each of your Vehicles. For each Vehicle Type you set 4 MPG bands representing performance from worst performing (band 1) to best performing (band 4). Using these bands and applying the points set in Analytics Configuration the following rules apply in the Grading report:
- 15 points or more will grant an A grade
- 10 or higher B
- 7 or higher C
- 5 or higher D
- 3 or higher E
- Any score lower than 3 will award an F grade.
Grading Summary Report
The Grading Summary displays a simpler view of the Grading Detail report over many vehicles or drivers. To access this report either select it on the Report screen from the Falcon main menu, or if you have a Grading Detail report open there will be a link in the bottom left hand corner.
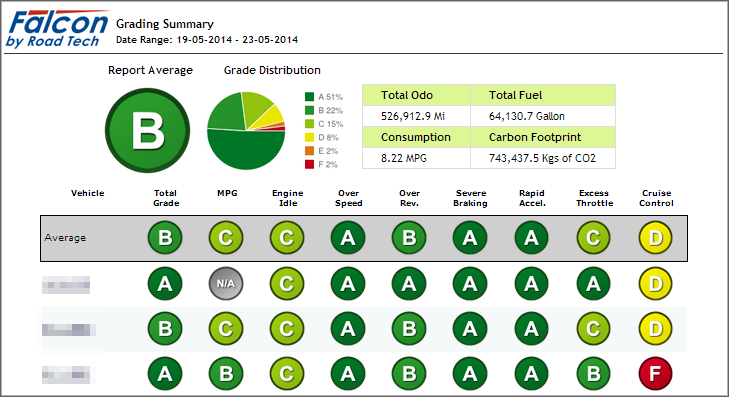
See below for an example of the Grading Summary report:

At the top of the report an overall grade across all the vehicles in the report is displayed, this is simply an average from the scores. Beside the grade is a summary table of the distance, fuel, consumption and carbon footprint for the report period.
The row with a grey background contains the average grade for each metric across all the selected vehicles.
Below is the list of vehicles, each with their own grades: Total Grade, MPG, Engine Idle, Over Speed, Over Rev., Severe Braking, Rapid Acceleration, Excess Throttle and Cruise Control. To view the detailed report for any of these records click on the vehicle registration.
Grade Definitions
Below is a table summarising the grade calculations for the Grading Reports:
| Metric | Point thresholds for each grade | |||||
|---|---|---|---|---|---|---|
| A | B | C | D | E | F | |
| Overall / Total Grade | >= 90 | >= 80 | >= 70 | >= 50 | < 50 | N/A |
| MPG | >= 15 | >= 10 | >= 7 | >= 5 | >= 3 | < 3 |
| Engine Idle | >= -1 | >= -10 | >= -20 | >= -40 | >= -60 | < -60 |
| Over Speed | ||||||
| Over Rev. | ||||||
| Severe Braking | ||||||
| Rapid Accel. | ||||||
| Excess Throttle | ||||||
| Cruise Control | >= 20 | >= 15 | >= 8 | >= 4 | >= 2 | < 2 |
